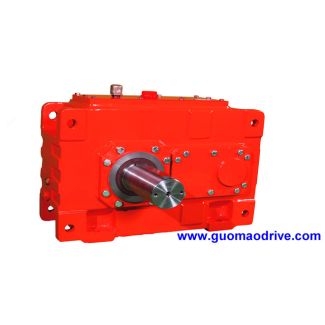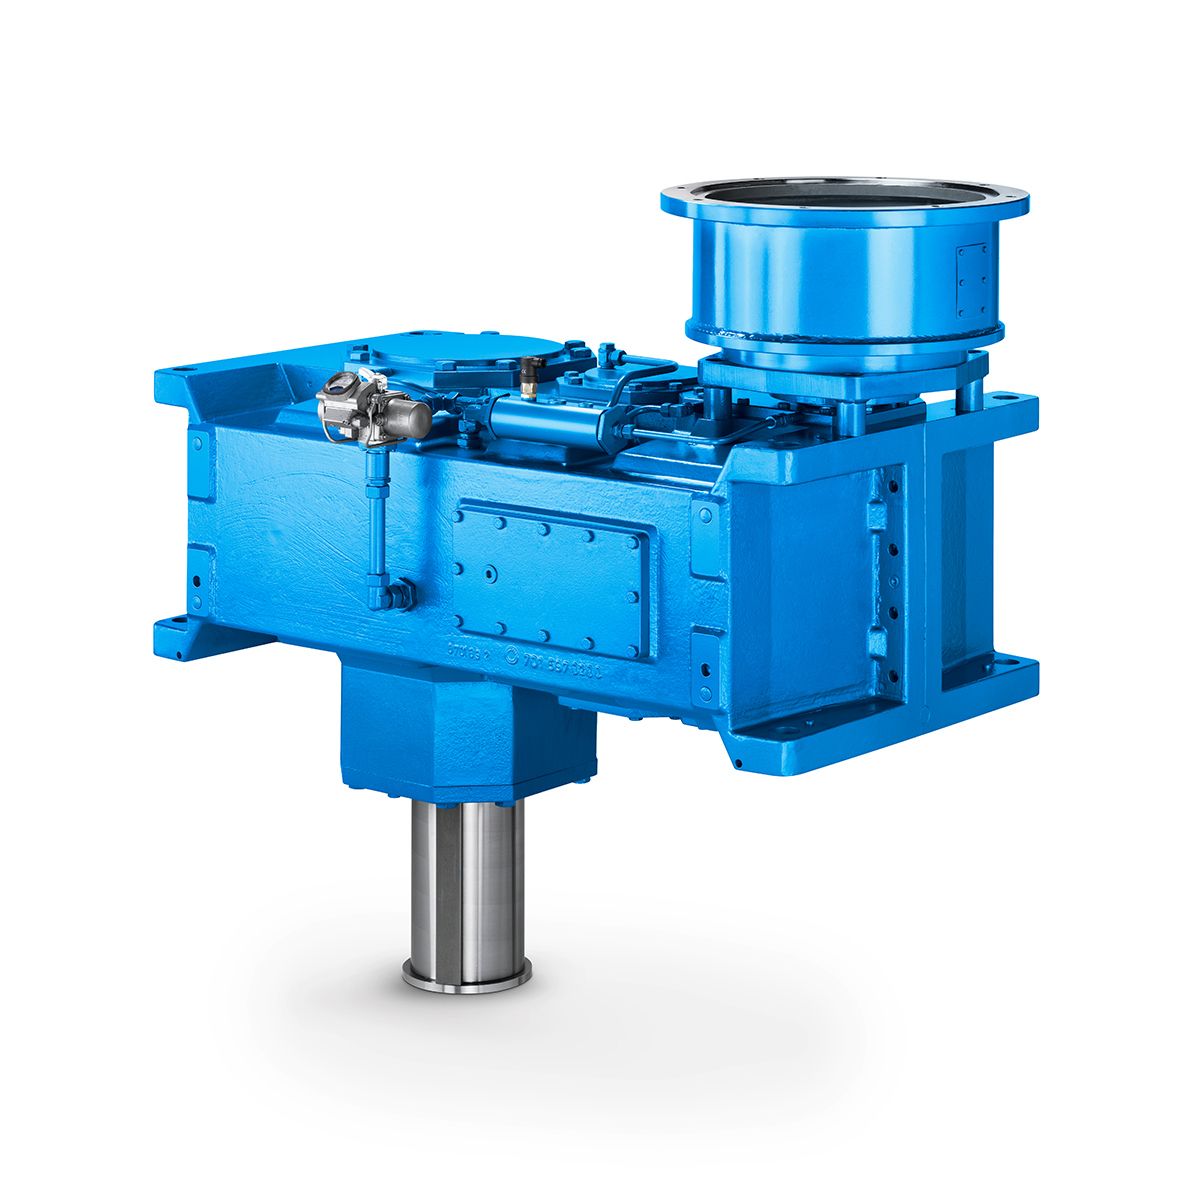
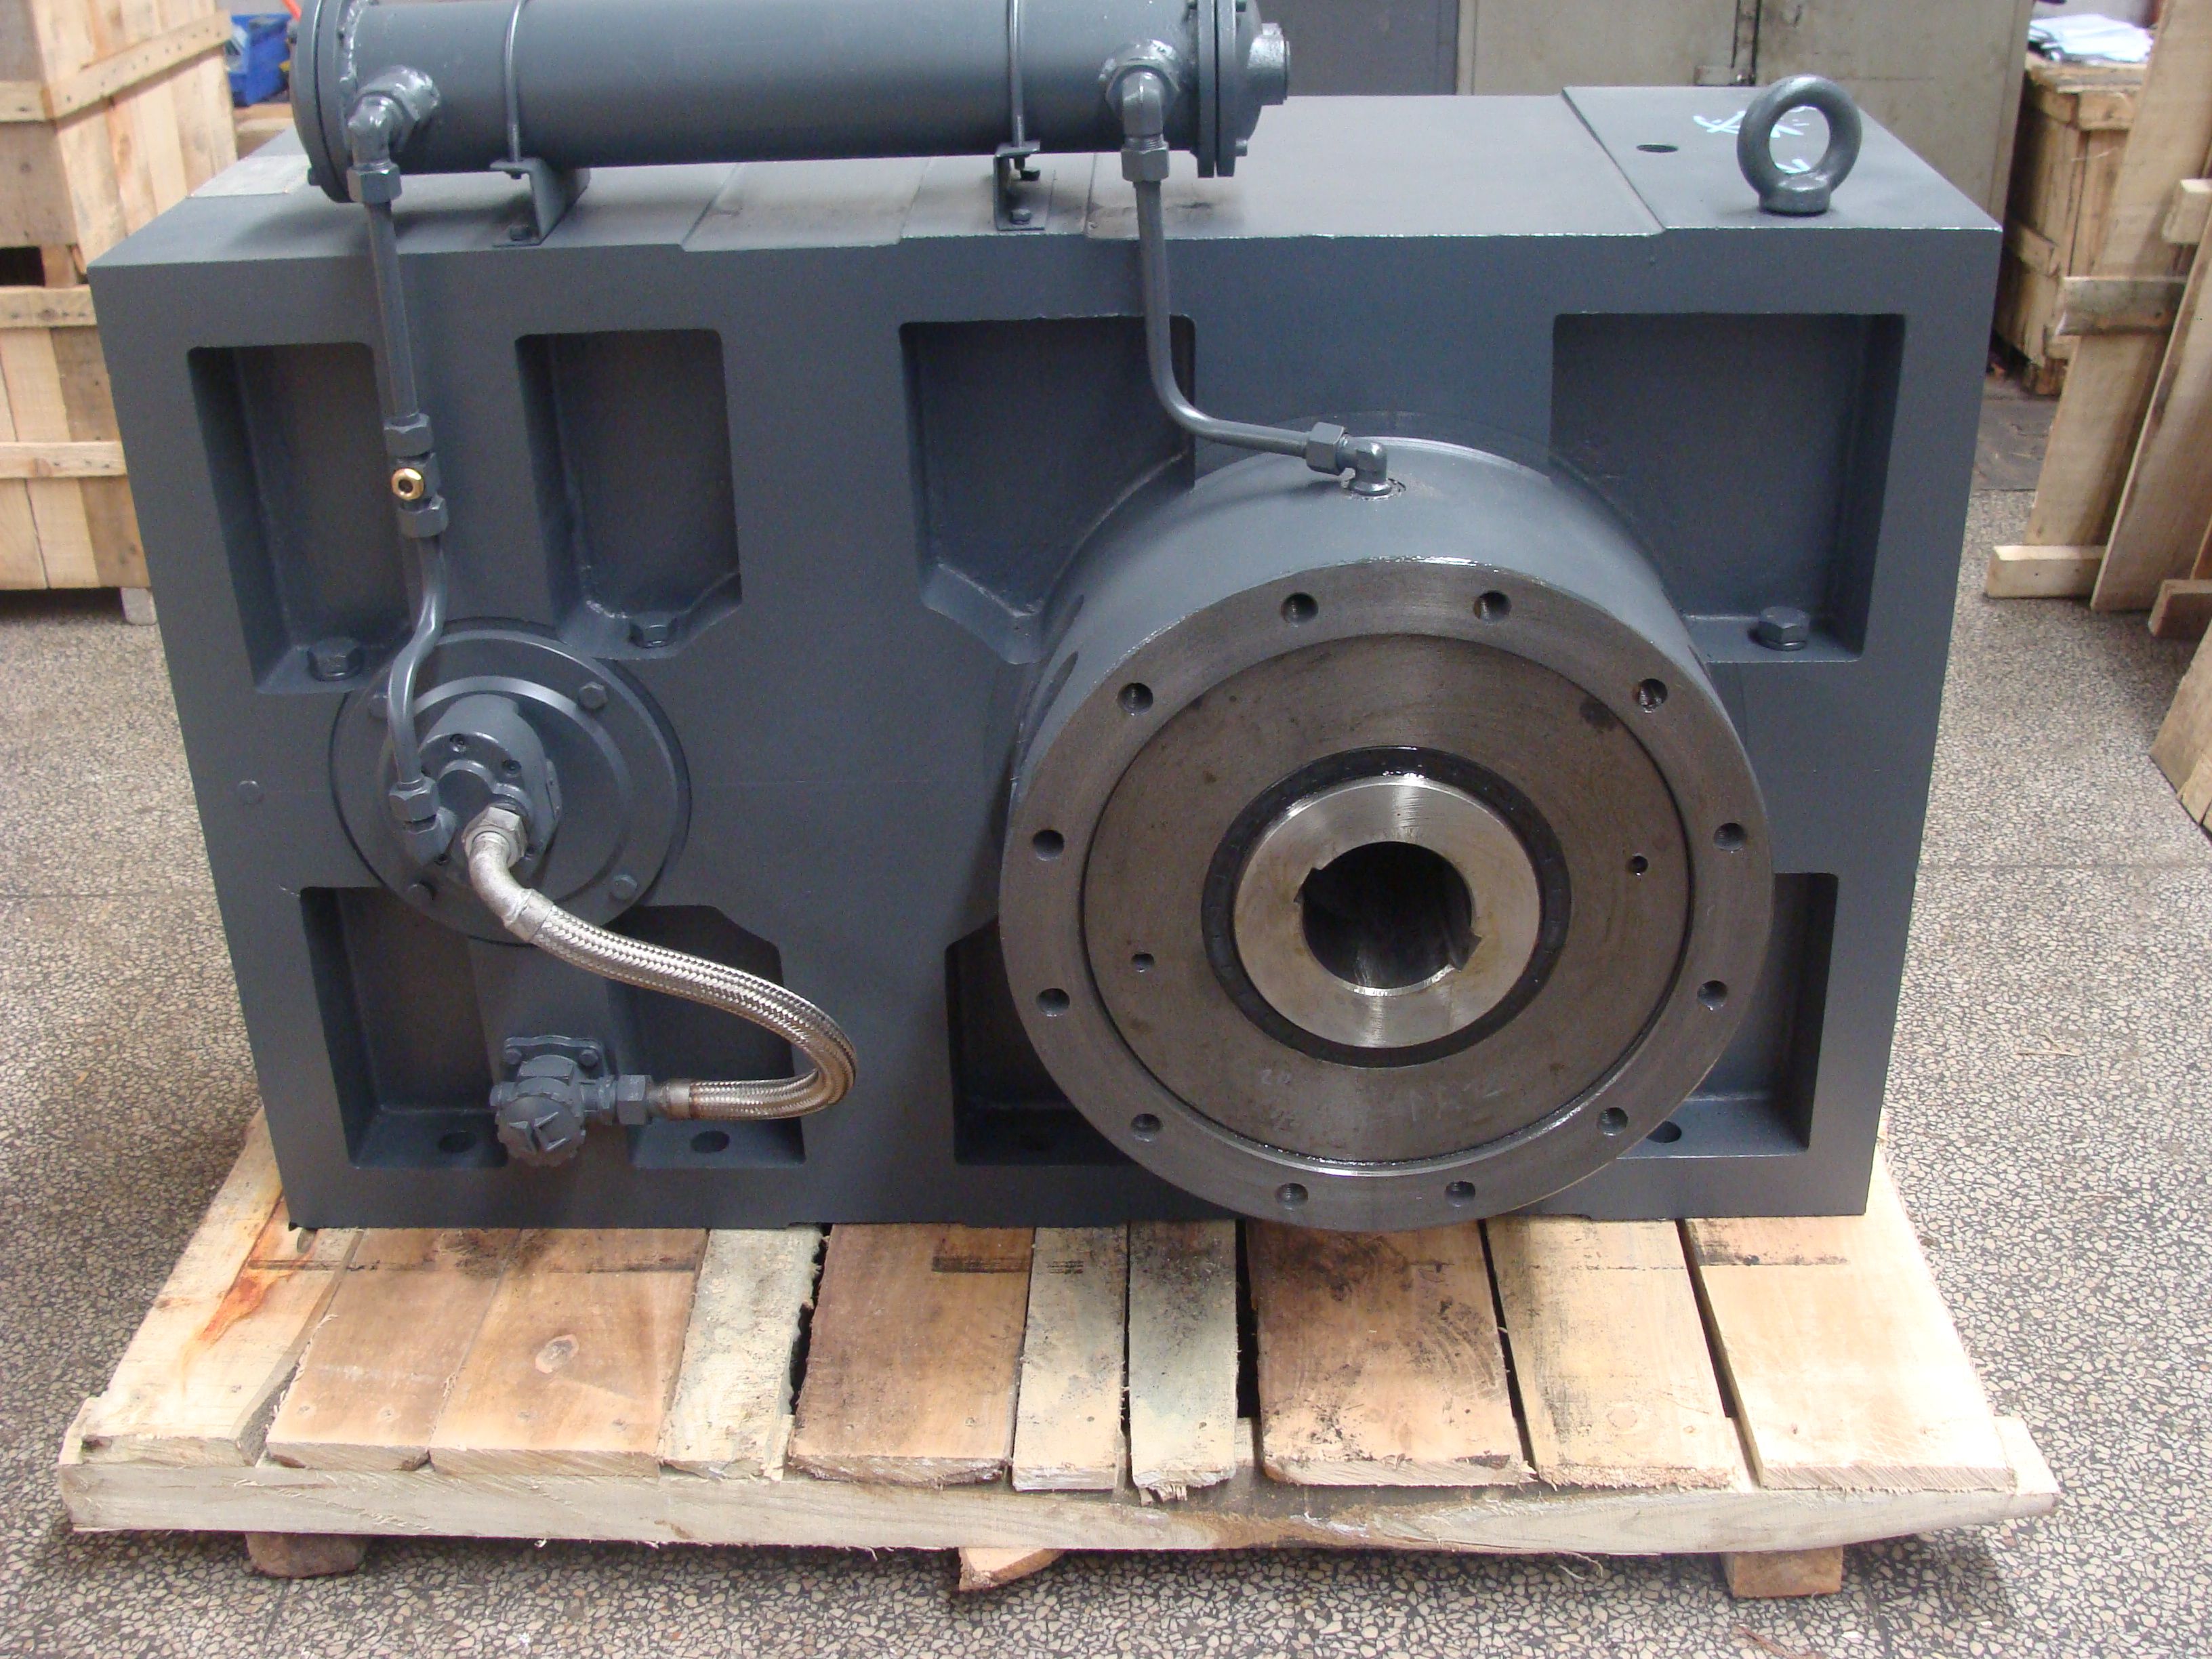
at high speed shaft HSS mounting on gear unit sid B4-CH-5B Bevel-helical gear reducer B4
In stock
SKU
B4-CH-5B
$7,178.57
Flender/Flender Gear Units/Bevel-helical gear reducer B4
term contracts female EMPLOYER OF CHOICE5 SUSTAINABILITY REPORT 2 Our employees worldwide* In the reporting year, total of 8,9 people were employed at Flender worldwide 9% of them full time and 8% on permanent contracts. We are pleased that the
  number of employees has remained constant in the second year as fully independent business. The year-on-year change is predominantly due
  to retirements. * mployees by headcount, as of the reference datefrom the personnel master data. There isnosignificant proportion of workforce
  that isnotemployed by Flender. 8,9 Employed by Flender worldwide 9% Full-time employees 8% Employees on permanent contracts5.1 OUR EMPLOYEES CONTINUED GRI 2-7, 1-8, 4-1 | SDG 5.1, 8.5, 8.6, 1.3 3+2+6+U2 3% 2% 6% 0+6+3+U2 0% 6% 3%2+2+7+U2 2% 2% 7% 0+6+3+U2 0% 6% 3%3+2+7+U2 3% 2% 7% 0+6+4+U2 0% 6% 4%Contract of employment (1-8 , ) Contract type Permanent Contract type Fixed-term AMCAS (Americas, Canada and Chile) APAC (China, India, Australia and all smaller Asian sites) EMEA (Europe,Serbia, South Africa, UAE, Dubai) KEY EMPLOYER OF CHOICE5 SUSTAINABILITY REPORT 2 1-8 2 2 2 NEW HIRES (4- By region 4 1% 7 1% 7 1% AMCAS 1 2% 4 5% 4 7% APAC 2 4% 3 5% 3 4% EMEA 2 5% 3 4% 3 4% By gender 4 1% 7 1% 7 1% Female 7 1% 1 2% 9 1% Male 3 8% 5 7% 6 8% By age group 4 1% 7 1% 7 1% <2 6 1% 6 9% 6 9% 2 1 3% 2 3% 2 4% 3 1 3% 2 3% 2 3% 4 4 9% 9 1% 8 1% 5 1 3% 4 6% 3 5% >6 8 2% 3 1% 8 1% EMPLOYEE FLUCTUATION (4- By region 3 1% 5 1% 8 1% AMCAS 2 7% 2 5% 2 3% APAC 1 3% 1 3% 3 3% EMEA 2 5% 3 6% 5 5% By gender 3 1% 5 1% 8 1% Female 6 1% 1 2% 1 2% Male 2 8% 4 8% 6 8% By age group 3 1% 5 1% 8 1% <2 8 2% 2 5% 1 2% 2 7 2% 1 2% 2 2% 3 1 3% 1 3% 3 3% 4 2 8% 5 1% 1 1% 5 4 1% 4 8% 6 7% >6 7 2% 5 1% 9 1%5.1 OUR EMPLOYEES CONTINUED GRI 2-7, 1-8, 4-1 | SDG 5.1, 8.5,8.6, 1.3 continued SUSTAINABILITY REPORT 2EMPLOYER OF CHOICE5 The importance of employee satisfaction We work in dynamic environment with constant changes and new opportunities. Our environment re
| Model Type | Bevel-helical gear reducer B4 |
|---|---|
| Gear Type | Bevel Helical Gear |
| Weight (kg) | 335.000000 |
| Ratio Range | 1 : 80…315 |
| Low Speed Output | Solid shaft without parallel key |
| Nominal Torque | 11600 Nm |
| Mounting Arrangements | Horizontal mounting position |
| Manufacturer | A. Friedr. Flender AG & Co. KG |
| Country of Manufacture | Poland |
| Data Sheet & Drawings | at high speed shaft HSS mounting on gear unit sid B4-CH-5B Bevel-helical gear reducer B4 |
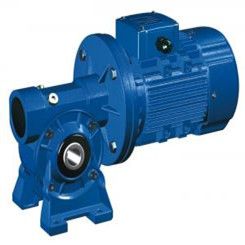
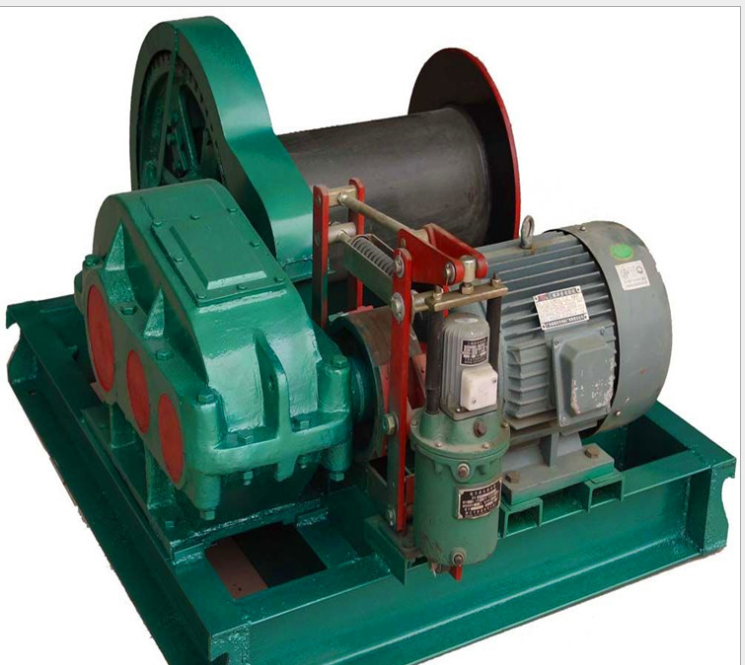
Related Products