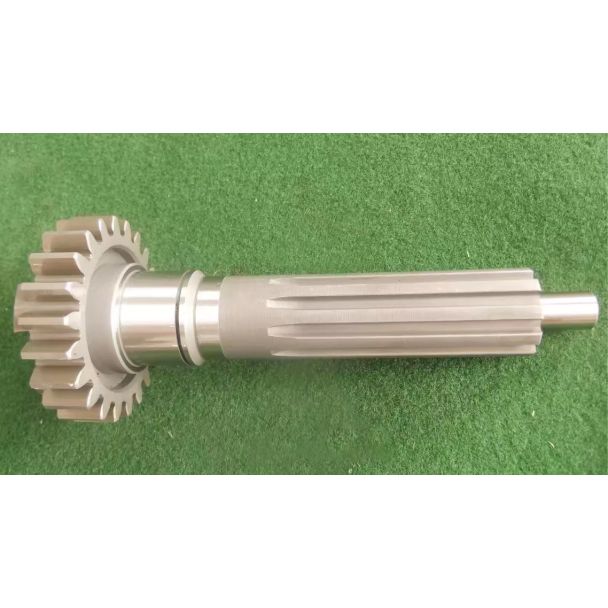
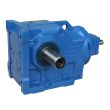
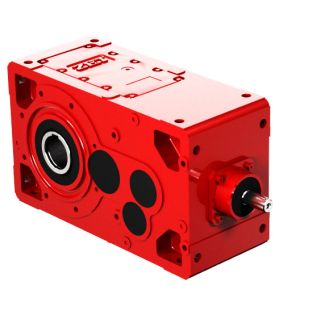
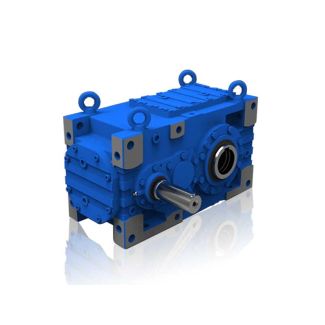
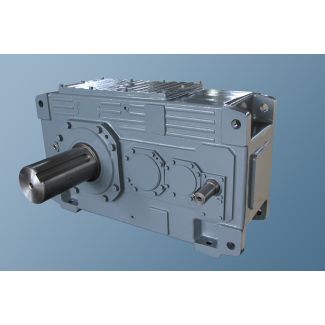
Bevel-helical gear box B2 ype H H Mass moments of inertia J gear unit size B2-HH9A
In stock
SKU
B2-HH9A
$35,892.86
Flender/Flender Gear Units/Bevel-helical gear box B2
Module Blowers Optimised Process Control Advanced Process Control FB Cascade NH 4+/ DO FF-FB NH 4+/DO Aeration Energy Parameter Consumption MWh/yr 4,6 3,9 3,6 3,6 Consumption Saving MWh/yr 7 1,0 1,0 % Consumption Saving % 1 2 2 Consumption Cost
  /yr 2,9,1 2,4,0 2,2,0 2,2,9 Consumption Cost Saving /yr 4,1 6,1 6,1 % Consumption Cost Saving % 1 2 2
  Demand Saving kW 8 1 1 Final Effluent Quality* FSA mgN/ 0.4 0.3 0.8 0.8 Ortho mgP/ 0.3 0.0 0.0
  0.0 Nitrate/Nitrite mgN/ 6.0 3.0 1.5 1.0 The following is noted: Consumption energy and cost savings increase further as follows: From 9-1% and 1-1% respectively with simple optimised process control From 1-2% and 1-2% respectively with advanced process control 4.7.4 Comparison of Feasible ECMs summary of the financial analysis for implementing the feasible aeration ECMs discussed is presented in Table 4-1. Simple payback was adopted for the purposes of this project because its simple quick way of assessing how long funding is committed to project. However, simple payback when compared with other superior economic performance evaluation techniques has the following main disadvantages: it focuses on how quickly the initial investment can be recovered and does not take into account all costs and savings after the payback period it does not take into account the time value of money when comparing future savings with initial capital investment Simple payback is therefore not true indi cator of long-term economic performance. For practical implementation of ECMs internationa best practice recommends that more superior economic evaluation technique such as life cycle cost analysis (LCCA) be adopted. LCCA is particularly suited for evaluating energy conservation projects because of the following: it takes into account all costs incurred over the service life of project (.. construction, maintenance & operation, recapitalization, and disposal) 4-2 i
| Model Type | Bevel-helical gear box B2 |
|---|---|
| Gear Type | Bevel Helical Gear |
| Weight (kg) | 1675.000000 |
| Ratio Range | 1 : 5…18 |
| Low Speed Output | Hollow shaft with keyway acc. to DIN 6885/1 |
| Nominal Torque | 29900 Nm |
| Mounting Arrangements | Horizontal mounting position |
| Manufacturer | Flender Himmel RSA |
| Country of Manufacture | Serbia |
| Data Sheet & Drawings | Bevel-helical gear box B2 ype H H Mass moments of inertia J gear unit size B2-HH9A |
