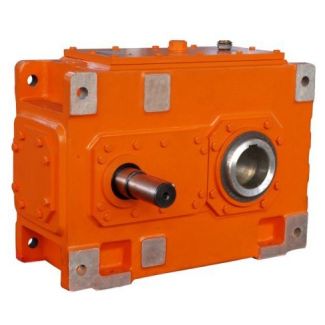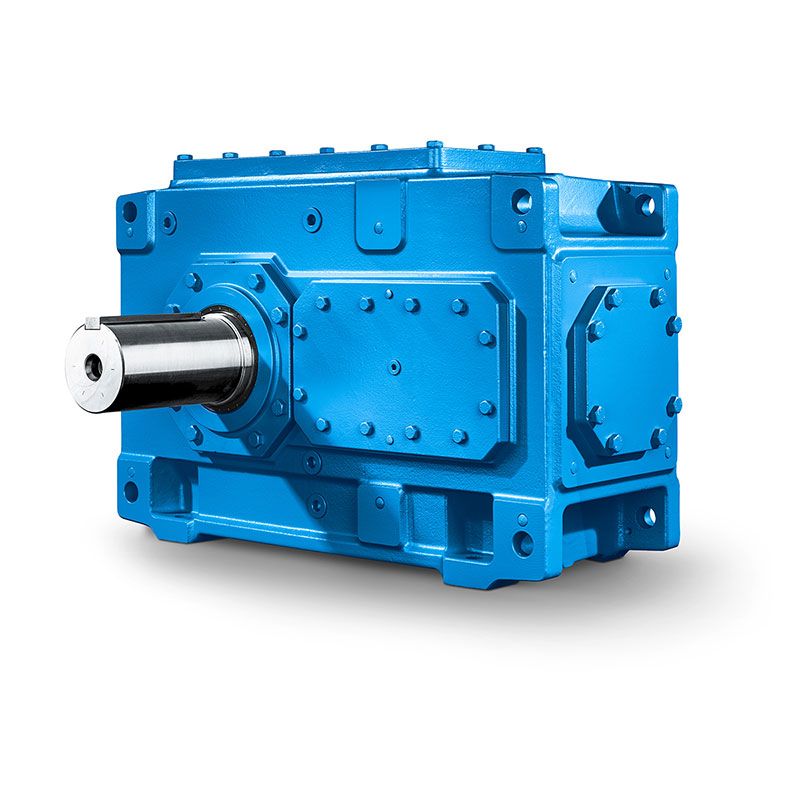
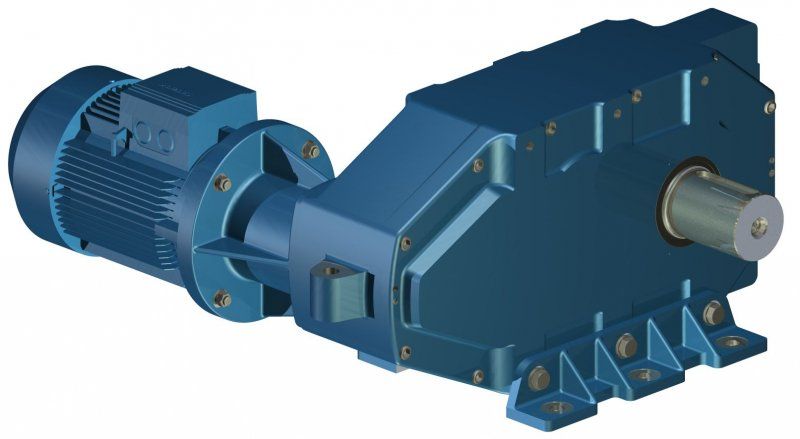


B3-CV21-B t G l kg Flanged shaft HFV H On reque Bevel-helical speed reduction gearbox B3
In stock
SKU
B3-CV21-B
$197,142.86
Flender/Flender Gear Units/Bevel-helical speed reduction gearbox B3
phy deviation explicitly to the pinion and wheel by analyzing the transmission error. Surface Structure and Roughness Apart from angular and crowning deviations and ank bias, micro geometry deviations may also occur in the ank topography. As an example, Fig.
  5.2 shows the transmission error of bevel gear set without and with micro geometry tooth ank waviness. In accordance with
  the graphs in Figs. 5.2 and5.2, the original transmission error curve is parabolic (Fig. 5.2 top-left) with amplitude distributions falling
  exponentially as the order rises (Fig. 5.2 top-right). If waviness is superimposed to the original parabolic form, Fig.5.2 bottom-left, the change in the amplitudes of the rst to the fourth order is virtually negligible, Fig. 5.2 bottom-right. Contrary to the mesh without waviness, Fig. 5.2 Ease-off, contact pattern and transmission error of bevel gear set with topography deviations5.3 Noise Excitation Governed by Manufacturing 2 however, this mesh also shows amplitude peaks from the fth to tenth order. Depending on the waviness period, such amplitude peaks may occur at even higher orders. Tooth-to-Tooth Pitch Deviations and Damage Tooth-to-tooth pitch deviations and damage are disturbances leading to temporary change in an otherwise regular transmission error curve. Figure 5.2 shows the transmission error curve of 1-tooth gear for which one tooth engagement displays clear amplitude peak. This disturbance causes pulsatile change in the total transmission error and is expressed in the order spectrum by signicant increase in spectral lines through- out the range of orders. The amplitudes of these additional, pulse-dependent spectral lines are most pronounced below the rst mesh order, decreasing in level with ascending order. Knowledge of the inuence of different geometry deviations on the transmission error curve and its spectral composition allows the identication of geometry deviations when analyzing the results of single-ank test. Fig. 5.2 Transm
| Model Type | Bevel-helical speed reduction gearbox B3 |
|---|---|
| Gear Type | Bevel Helical Gear |
| Weight (kg) | 9200.000000 |
| Ratio Range | 1 : 12.5…71 |
| Low Speed Output | Solid shaft without parallel key |
| Nominal Torque | 420000 Nm |
| Mounting Arrangements | Vertical mounting position |
| Manufacturer | Flender..Ltd China(Tianjin) |
| Country of Manufacture | China |
| Data Sheet & Drawings | B3-CV21-B t G l kg Flanged shaft HFV H On reque Bevel-helical speed reduction gearbox B3 |
Related Products